
Het comment form bij Veerle is borked voor het moment, en ik vertrek zometeen naar aperitieven en barbecues allerlei— dan maar op deze wijze, met een goeie ouwe trackback.

I was preparing a blog entry about browser stats just yesterday–interesting to see these numbers!
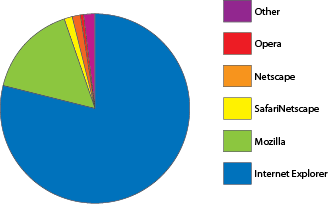
My personal website stats for the 151 164 visitors in the month of June so far tell me:
78.9% IE
15.9% FF and related
1.5% Safari
1.4% Netscape Navigator
0.5% Opera
1.8% Others
The main site at my job has the following for the month of June 2005:
91.8% IE
5.2% FF and related
0.8% Safari
0.5% Netscape
0.3% Opera
1.4% Others
This may sound “bad”, but there is some movement there. June 2004 had this:
97.1% IE
1% Mozilla
0.7% Netscape
0.2% Safari
0.2% Opera
0.8% Others
Interesting to see what browser stats say about a site’s visitors 🙂
Oh, and for the tutorial Static asked about: most people may not neccesarily associate Illustrator with pie charts, but there’s been quite a competent charting and graphing function in there for ages.
Quick step-through in Illustrator CS2:
1) select the Pie Graph Tool

2) Illustrator creates a black one-value pie chart by default and gives you a simple spreadsheet to enter data:

3) Enter your numbers. When you make a pie chart, put your labels in the top row and the values across and press the checkmark apply button at top right to see the chart:

4) Select the individual pie slices with the white direct selection arrow and apply colours to taste
Select the entire pie chart and add a white outline to separate the slices (note that this works better if you don’t have as many small slices as I have in this example)

Now at this point you may be tempted to bring the entire thing over to Photoshop to add the glow effect and any necessary subtle drop shadows. I know I would: I feel I have more control over that kind of stuff in Photoshop and I’m still not comfortable doing what I feel are “pixel” operations in Illustrator.
Still, no real need to do so:
5) Select the entire pie chart and go to Effect > Stylize > Inner glow. Fiddle with the numbers until satisfactory, like so:

Note that if you use the direct selection tool and do the inner glow you can get a sort of pillow emboss effect (if that’s your bag 🙂

6) Select the elements you want “drop shadowed” and go to Effect > Stylize > Drop Shadow. Click the “preview” checkbo and adjust to taste — I used

The result:

This could use some tweaking (add the gradient in the legend, order the legend in descending order instead of ascending, tweak the colours and the glow/shadow effects to taste, etc.) but all that is easily done.
Just remember that you can find all the things you did to the different objects in the Appearance tab (Shift-F6 to toggle it, BTW). Select the entire pie chart and you’ll see the Inner Glow; double click that and you can adjust it. “Direct select” one slice and you’ll see its colour, etc.
Have fun!
Reacties
3 reacties op “Browser stats”
Tiens
https://blog.zog.org/2005/06/browser_stats.html en http://www.duoh.com/varia/illustrator_charts/….
de tutorial van Michel in een new window geopend, maar vond het teveel werk –niet dat ‘mijn’ manier noodzakelijkerwijs minder werk vraagt.) De statistieken worden bijgehouden via AWStats (demo alhier). De weinige requirements om het te gebruiken zijn:
[…] https://blog.zog.org/2005/06/browser_stats.html en http://www.duoh.com/varia/illustrator_charts/. […]